![]()
Updated May-2026 Workday-Pro-HCM-Reporting Free Exam Files Downloaded Instantly
Practice Exams and Training Solutions for Certifications
NEW QUESTION # 29
You have received a request for a new custom report that is similar to the Workday-delivered report Compare Workers, and you run the Workday Standard Reports report.
What information can you use to determine if you can copy Compare Workers to create a new custom report?
- A. The report shows Yes in the Schedulable column.
- B. The Description column is not empty for the report.
- C. The report shows Report Writer in the Type column.
- D. You can access the report's Related Actions from the Report column.
Answer: C
Explanation:
The Workday Standard Reports report lists all delivered reports and key attributes. Only standard reports created with the Report Writer tool can be copied and modified into custom reports. The "Type" column indicates whether the report is a Report Writer report.
From the Workday Reporting documentation:
"Workday delivers standard reports that are available for all customers. If necessary, you can copy many of the Workday-delivered reports created with the report writer to create a custom report and modify it as needed." Thus, the correct indicator is C. The report shows Report Writer in the Type column.
NEW QUESTION # 30
You are building a report that shows employee performance ratings and their associated performance review details. The report uses the Performance Review primary business object. Using a calculated field, what formula should you use to retrieve the employee's job title from the related Worker business object?
- A. Lookup Range Band
- B. Evaluate Expression Band
- C. Lookup Related Value
- D. Aggregate Related Instances
Answer: C
Explanation:
The correct choice is Lookup Related Value, because this function allows you to retrieve a field from a related business object that is not directly stored on your primary object. In this scenario, the primary business object is Performance Review, which holds performance-related data but not job-related data such as Job Title. Since Job Title resides on the Worker business object, you need to link from Performance Review to Worker and then retrieve Job Title.
The Workday reporting guide explains: "Lookup Related Value - Returns a field from a related business object. Use this to bring data from associated objects into a report when the field is not directly available on the primary object." . This ensures the Performance Review data can be combined with Job Title for meaningful insights.
By contrast, Aggregate Related Instances is used to roll up multiple related values, Range Band applies thresholds, and Evaluate Expression Band is used for conditional ranges, not cross-object retrieval.
NEW QUESTION # 31
An HR analyst has many visualizations in different discovery boards that use the Workers for HCM Reporting data source on the Worker primary business object. The analyst wants to drill into one of the visualizations by Worker. Upon drilling, the analyst notices that Worker is not a listed Drill By field option. They want to drill by Worker without editing the Drill By list of the other visualizations.
How would the analyst configure this?
- A. Create a control from a sheet filter and filter the data by Worker from the Control Panel.
- B. Drag and drop the Worker field in one of the dimensions of this visualization in the Builder Panel.
- C. Override the Drill By field list and add Worker in the Configuration Panel for this visualization.
- D. Add Worker as a Drill By field from the Maintain Field Lists for Discovery Boards report.
Answer: C
Explanation:
In Discovery Boards, drill behavior is defined in the Drill By field list. To add Worker as a drillable option in just one visualization, the analyst can override the Drill By list in the Configuration Panel of that visualization. This allows Worker to appear as a drill dimension without altering the defaults applied across other visualizations.
From the Workday documentation: "You can override Drill By field lists in the visualization configuration panel. This enables drill customization on a per-visualization basis without impacting other discovery boards." The other options are less appropriate: Maintain Field Lists changes the default for all boards; adding Worker as a dimension affects grouping, not drilling; and sheet filter controls allow filtering but do not add drill options.
Thus, the correct choice is D. Override the Drill By field list and add Worker in the Configuration Panel for this visualization.
NEW QUESTION # 32
You would like to build a composite report using worker data in which report users can select a value from the output and view the worker, worker's location, and worker's manager.
Where will you need to configure the drill down values?
- A. In the composite report prompt settings
- B. In the subreports
- C. In the composite report rows
- D. In the composite report columns
Answer: D
Explanation:
In composite reports, drill-down functionality is controlled at the column level. By configuring drillable fields on the output columns, users can select values and view related details, such as worker name, location, and manager.
From the Workday documentation: "Drill-down values in composite reports are configured on columns. Columns can be set to include drillable fields, allowing users to select a value and view related data." Rows determine how data is grouped, prompts filter initial results, and subreports provide the raw data but do not directly control drillable field configurations.
Therefore, the correct configuration is C. In the composite report columns.
NEW QUESTION # 33
You have a Pivot Table visualization in your discovery board.
What type of report will Workday create if you generate a report from this visualization?
- A. XpressO
- B. Advanced Report
- C. Matrix Report (with a chart and a table)
- D. Matrix Report (with only a table)
Answer: D
Explanation:
In Workday Discovery Boards, visualizations such as pivot tables are based on summarized and grouped data. When you choose to generate a report from a Pivot Table visualization, Workday converts the visualization into a Matrix Report that includes only a table, preserving the row and column groupings and summarizations used in the pivot.
The Workday HCM Reporting documentation states:
"When generating a report from a pivot table visualization, Workday creates a matrix report that reflects the grouped and summarized structure of the pivot."
"Charts are not included when generating reports from pivot table visualizations; the output is a table-only matrix report." Advanced Reports are generated from non-pivot, row-based visualizations. XpressO is not used for discovery board-generated reports. Matrix reports with charts are created only when the visualization includes a chart component, which pivot tables do not.
Therefore, the correct answer is B. Matrix Report (with only a table).
NEW QUESTION # 34
You would like to create an advanced report that contains information about employees and their dependents.
Where can you go to identify the field that links the two business objects, Worker and Dependent?
- A. The Related Business Object column of the Report Fields report
- B. The Related Business Objects tab of the Business Object Details report
- C. The business object's Related Actions > Reporting > Report Fields and Values
- D. The Columns tab of a report definition
Answer: B
Explanation:
To connect multiple business objects in reporting, Workday provides the Business Object Details report. The Related Business Objects tab within this report shows how different business objects are linked (e.g., Worker to Dependent). This enables report writers to identify which fields connect the primary and secondary objects.
From the Workday Reporting documentation:
"The report data source provides the view into the primary business object. This object gives you access to class report fields as well as links to related business objects." Therefore, the correct answer is C. The Related Business Objects tab of the Business Object Details report.
NEW QUESTION # 35
A customer was receiving a report on a weekly basis but has not received it since the new year started.
What task should you use to confirm the report frequency?
- A. View Alerts
- B. Mass Operation Management
- C. Run History
- D. Scheduled Future Processes
Answer: D
Explanation:
When a report is scheduled to run at a recurring interval (daily, weekly, monthly, etc.), Workday tracks this under the Scheduled Future Processes report. This task allows administrators and report owners to view when reports are set to run, the frequency of execution, and the schedule start and end dates. If a report stopped running after the new year began, the most likely cause is that the scheduling end date expired on December 31, meaning no new jobs were generated for the new year.
From the Workday Reporting binder: "Workday provides scheduling options to run reports at set frequencies. You can confirm upcoming scheduled report runs in the Scheduled Future Processes report." This provides visibility into whether the report is still scheduled and when it is next expected to execute.
The other answers are incorrect: View Alerts relates to system notifications, Mass Operation Management is not for reporting, and Run History shows past runs but not future scheduling. The correct option is C. Scheduled Future Processes.
NEW QUESTION # 36
A Hire event has an Effective Date of 09/02/2023.
What would be the Record Date of the Hire event on the Trended Workers object?
- A. 9/30/2023
- B. 9/1/2023
- C. 10/31/2023
- D. 9/2/2023
Answer: A
Explanation:
In Workday trending reports, the Record Date for a transaction is not always the same as the event's Effective Date. Instead, trending data is captured based on the periodicity of the trended workers configuration, most commonly set to the end of each month. For Hire events, the Effective Date is when the change takes effect in the system, but the trended data is stored using the month-end Record Date.
From the Workday binder: "Trended Workers captures snapshots of worker data at periodic intervals (e.g., monthly, quarterly). A transaction such as a hire or termination is recorded in trending as of the last day of the period in which the effective date occurs." In this scenario, the Hire Effective Date of 09/02/2023 falls in September. The Record Date is therefore the last day of September, 09/30/2023, not the effective date itself.
Thus, the correct answer is C. 9/30/2023.
NEW QUESTION # 37
How can you capture proposed values relating to a business process event on a report?
- A. Apply a report filter that only returns data that contains "proposed" in the field name.
- B. Use a data source that is enabled for effective dating.
- C. Use an event-related business object as the primary business object or as a related business object.
- D. Configure Lookup Value as of Date calculated fields that return field values as of the date before the business process events occurred.
Answer: C
Explanation:
To capture proposed values from a business process event, you must use an event-related business object. For example, a Staffing Event business object can provide both the current and proposed values of job, location, or compensation during a transaction.
The Workday binder clarifies: "The report data source provides the view into the primary business object. This object gives you access to class report fields as well as links to related business objects." . By selecting an event-related object as the report's data source, you can retrieve pending changes alongside existing values.
Other answers are insufficient: "effective dating" only retrieves data snapshots, and filters cannot detect "proposed" unless tied to the correct object. Lookup Value as of Date would return historical data, not future proposed changes.
NEW QUESTION # 38
You are configuring a data column on a composite report. You would like to map a subreport prompt to a value in a prompt set, but the prompt is not appearing on the Map Sub Report Prompts grid in the column configuration options.
What could be causing this?
- A. You already set a default value for the prompt on the subreport.
- B. You do not have access to the domain securing the report prompt.
- C. The Do Not Prompt at Runtime checkbox is selected for the prompt on the subreport.
- D. You did not select Use Value From Prompt Set as the default prompt value in the subreport.
Answer: C
Explanation:
In Workday, when you configure composite reports, you can map subreport prompts to prompt sets for greater flexibility. However, if the Do Not Prompt at Runtime checkbox is selected on the subreport prompt, the prompt will not be exposed in the Map Sub Report Prompts grid. This is because Workday interprets the prompt as suppressed and therefore not available for mapping at runtime.
From the Workday binder: "Prompts suppressed with the Do Not Prompt at Runtime option will not appear in the Map Sub Report Prompts grid in composite report configuration. To map a subreport prompt, ensure the prompt is enabled at runtime." Other options do not directly cause this issue: default values on prompts do not suppress them, security issues would block data but not hide the prompt mapping, and prompt set configuration errors affect defaulting but not visibility.
Thus, the correct answer is B. The Do Not Prompt at Runtime checkbox is selected for the prompt on the subreport.
NEW QUESTION # 39
You want to view benefit cost by benefit enrollment for the current year compared to the prior year to evaluate increases or decreases in plan enrollment, displaying formatted cost and count variance calculations.
What type of report would allow you to do this?
- A. Matrix Report
- B. Composite Report
- C. Advanced Report
- D. Trending Report
Answer: D
Explanation:
To evaluate year-over-year changes in benefit costs and enrollments, you need historical data comparisons over time. The Trending Report type is designed for exactly this use case, leveraging data sources like Trended Workers to display snapshots at periodic intervals and calculate variances between time periods.
From the Workday binder: "Trending reports allow you to track changes to worker data across time. These reports support analysis of headcount, demographics, benefit enrollments, and cost variances year-over-year or month-over-month." Advanced and Matrix reports provide strong analysis capabilities, but they are based on current or related effective-dated data, not time-series snapshots. Composite reports combine multiple subreports but do not inherently manage trending data or variance calculations across years.
Therefore, the only correct option for year-over-year benefit enrollment and cost variance is D. Trending Report.
NEW QUESTION # 40
You are viewing a worker's Workday profile and would like to know more about the data behind the worker's job profile of Senior Benefits Analyst so that you can plan a report.
What is the quickest way to identify the business object associated with this field and other relevant field values relating to this instance?
- A. Run the Business Object Details report for the Job Profile business object.
- B. Run the Report Fields report.
- C. Select the job profile's Related Actions icon and select Reporting > Report Fields and Values.
- D. Create a custom report using the Create Custom Report task.
Answer: C
Explanation:
The Report Fields and Values option is available via the Related Actions icon for fields on worker profiles. This is the quickest way to see which business object is tied to the field (e.g., Job Profile) and which field values are available for reporting.
From the Workday documentation:
"To determine which business object a field belongs to and the values available for that field, select the Related Actions > Reporting > Report Fields and Values option." Thus, the quickest method is B. Select the job profile's Related Actions icon and select Reporting > Report Fields and Values.
NEW QUESTION # 41
You only want to show snapshot data on a custom trending report that uses the Trended Workers data source.
How can you achieve this with minimal impact to report performance?
- A. Add a report filter using the Snapshot field.
- B. Use the Trended Workers for Planning data source filter.
- C. Run the Maintain Trended Workers task and configure the default record type.
- D. Configure the default value of the Record Type prompt.
Answer: A
Explanation:
The Record Type field in Trended Workers distinguishes between snapshots and transactions (such as hires, terminations, or transfers). To focus only on snapshot data, you can apply a report filter on the Snapshot field, ensuring only monthly or quarterly snapshots are displayed. This approach improves report performance because filtering happens at the report level without modifying global trending settings.
From the Workday reporting documentation: "Trended Worker data includes snapshots and transactions. To restrict a report to snapshots, apply a filter on the Record Type or Snapshot field." Other answers involve system-wide changes or unnecessary complexity: running Maintain Trended Workers redefines system defaults, configuring prompts adds user interaction overhead, and Trended Workers for Planning is a different data source intended for forecasting.
Thus, the most efficient option is B. Add a report filter using the Snapshot field.
NEW QUESTION # 42
Refer to the following scenario to answer the question below.
You have prepared the following matrix report for a recruiting manager.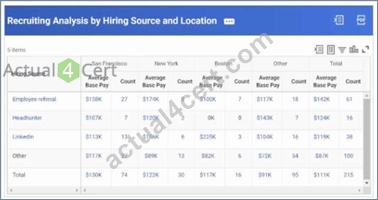
The recruiting manager would like to view the top ten hiring sources, rather than just three.
How can you adjust the report definition to address this requirement?
- A. Edit the Maximum Number of Rows field.
- B. Edit the Sort Rows field on the Row Grouping column.
- C. Configure a Field Values group on the Group by Field.
- D. Edit the Axis Scale on the Output tab.
Answer: A
Explanation:
In Workday matrix reports, the number of rows returned is controlled by the Maximum Number of Rows setting. By default, reports may limit output rows (for example, showing only the top 3). To display more results-such as the top 10 hiring sources-you must increase this value in the report definition.
From the Workday Reporting documentation:
"You can limit or expand the number of rows displayed in a matrix report by editing the Maximum Number of Rows field."
"To display more than the default, update the value in the report definition." Therefore, the correct way to adjust this report to display the top 10 hiring sources is B. Edit the Maximum Number of Rows field.
NEW QUESTION # 43
You have created a composite report and are trying to add a matrix report as a subreport. However, when trying to configure a Data column, the matrix report is not available to select in the Sub Report Name field.
What can you check to identify the cause of this issue?
- A. Check that the prompt defaults in the matrix report align with the prompt defaults defined in the composite report's Report Settings.
- B. Check that the summarization fields in the matrix report also match the selections in the Field to Aggregate field in the Data column settings.
- C. Check that every field in the composite report's set of fields that are enabled for filtering and grouping also exists as a group-by field in the matrix report.
- D. Check that the configurations on the Filter Data in Sub Report grid also exist in the Filter tab of the matrix report definition.
Answer: C
Explanation:
For a matrix report to be used as a subreport in a composite report, the group-by fields in the matrix report must align with the fields enabled for filtering and grouping in the composite report. If this alignment does not exist, Workday does not allow the matrix report to appear as a valid subreport option in the Sub Report Name dropdown.
From the Workday binder: "To include a matrix report as a subreport in a composite, the group-by fields of the matrix must match the fields enabled for grouping in the composite report. If these do not match, the matrix will not appear in the Sub Report Name selection." Other factors such as prompt defaults or filter settings may impact usability, but they do not prevent the matrix report from being selectable. The key dependency is the field alignment between the composite and the matrix group-by fields.
Therefore, the correct answer is A. Check that every field in the composite report's set of fields that are enabled for filtering and grouping also exists as a group-by field in the matrix report.
NEW QUESTION # 44
You only want to show snapshot data on a custom trending report that uses the Trended Workers data source.
How can you achieve this with minimal impact to report performance?
- A. Add a report filter using the Snapshot field.
- B. Use the Trended Workers for Planning data source filter.
- C. Run the Maintain Trended Workers task and configure the default record type.
- D. Configure the default value of the Record Type prompt.
Answer: A
Explanation:
The Trended Workers data source contains both snapshot records (period-end views of worker data) and event/transaction records (such as hires, terminations, and job changes). When the reporting requirement is to display only snapshot data, the most efficient and least disruptive approach is to apply a report-level filter using the Snapshot (or Record Type = Snapshot) field.
Workday HCM Reporting documentation explains that filtering at the report level allows the system to limit returned records without changing global trending configurations or requiring additional processing. This approach has minimal performance impact because it operates on already-generated trended data rather than forcing the system to recalculate or regenerate records.
Relevant documentation guidance includes:
"Trended Workers includes both snapshot and transaction records. Use report filters to restrict output to snapshot data when required."
"Avoid changing system-wide trending configurations when report-level filtering satisfies the business requirement." The other options are less appropriate:
Setting default prompt values still allows non-snapshot data to be retrieved.
Trended Workers for Planning is a different data source with a different purpose.
Running Maintain Trended Workers changes system configuration and impacts all trending reports.
NEW QUESTION # 45
An HR administrator shares a discovery board with a manager and gives the manager Can Edit permissions. The manager is able to open Drive and access the discovery board. However, upon opening the discovery board, the manager notices that there are placeholders for each visualization and the data does not display.
What permission does the manager need to view the data in the visualizations?
- A. The data source used in each visualization
- B. The Drive domain
- C. The Discovery Boards: Create domain
- D. Can View permissions on each visualization
Answer: A
Explanation:
Discovery boards in Workday Prism or Analytics rely on underlying data sources to populate visualizations. Even if the manager has Can Edit or Can View access to the discovery board itself, they still need access to the domains or data sources used in the visualizations. Without this, placeholders appear instead of data.
From the Workday binder: "Discovery boards enforce Workday security. Users must have access to the underlying data sources or domains to view data in visualizations, regardless of board permissions." Giving "Can View" permissions on the visualization object itself or Drive access only affects sharing, not data. Discovery Boards: Create allows building new boards, not data access.
Therefore, the manager must have A. The data source used in each visualization.
NEW QUESTION # 46
Two people run the same report. One person can view all columns but the other person can only view some columns.
Why is the second user missing columns?
- A. The report uses an indexed data source.
- B. The first user did not manually share the report with the second user.
- C. The second user is not the report owner.
- D. The second user does not have access to the domain that secures the field.
Answer: D
Explanation:
Access to report fields in Workday is governed by security domains. If a user lacks access to the security domain that secures specific report fields, those fields will not appear in the report output for that user.
From the Workday Reporting documentation:
"A security group gets access to a security domain, which is a predefined set of related securable items. Securable items can include reports, tasks, data sources, and report fields." Therefore, the correct answer is C. The second user does not have access to the domain that secures the field.
NEW QUESTION # 47
You have created a composite report and are trying to add a matrix report as a subreport. However, when trying to configure a Data column, the matrix report is not available to select in the Sub Report Name field.
What can you check to identify the cause of this issue?
- A. Check that the prompt defaults in the matrix report align with the prompt defaults defined in the composite report's Report Settings.
- B. Check that the summarization fields in the matrix report also match the selections in the Field to Aggregate field in the Data column settings.
- C. Check that every field in the composite report's set of fields that are enabled for filtering and grouping also exists as a group-by field in the matrix report.
- D. Check that the configurations on the Filter Data in Sub Report grid also exist in the Filter tab of the matrix report definition.
Answer: C
Explanation:
For a matrix report to be eligible as a subreport in a composite report, Workday requires strict alignment between the composite report's enabled fields and the matrix report's group-by fields. Specifically, every field enabled for filtering and grouping in the composite report must also exist as a group-by field in the matrix report.
If this alignment does not exist, Workday excludes the matrix report from the Sub Report Name selection list because the system cannot reliably aggregate or align the summarized data across reports.
Workday HCM Reporting documentation states:
"When using matrix reports as subreports in composite reports, the group-by fields must align with the composite report's enabled grouping and filtering fields."
"Matrix reports that do not meet grouping alignment requirements will not be available for selection as subreports." The other options do not control subreport eligibility:
Summarization fields affect calculations, not availability.
Filter alignment is validated later, not at selection time.
Prompt defaults do not determine whether a report appears in the Sub Report Name field.
NEW QUESTION # 48
A worker report uses a filter based on the Location field, using the comparison type Prompt the user for a value. A user runs this report and leaves the prompt value blank.
What Worker instances display on the output?
- A. No Worker instances, regardless of the value of the Location field
- B. All Worker instances, regardless of the value of the Location field
- C. Only Worker instances where there is a value of the Location field
- D. Only Worker instances where the Location field value is blank
Answer: B
Explanation:
Workday report filters allow prompts so users can enter values when running a report. If the prompt value is left blank, Workday treats it as though no filter condition has been applied, so the system returns all available Worker instances regardless of the Location field.
From the Workday Reporting guide:
"Prompts - You can further narrow and refine your report results by having the user complete prompt fields before they run the report. You can set default values for prompts... If left blank, the filter condition is ignored and all data is returned." Therefore, the correct answer is D. All Worker instances, regardless of the value of the Location field.
NEW QUESTION # 49
......
Workday Workday-Pro-HCM-Reporting Exam Syllabus Topics:
| Topic | Details |
|---|---|
| Topic 1 |
|
| Topic 2 |
|
| Topic 3 |
|
| Topic 4 |
|
Q&As with Explanations Verified & Correct Answers: https://pass4sure.actual4cert.com/Workday-Pro-HCM-Reporting-pass4sure-vce.html